Gold is in the spotlight, and for good reason. Economic and political disorder, instability, and general uncertainty are dominating the markets this year, and they are tailor-made to support gold. Few assets have escaped the current market turmoil, but gold seems to be the clear exception.
That being said, it’s interesting (and cautionary) to note that gold was not completely immune to the panicky sell-off that occurred during the first few days after April 2nd. Gold initially declined over 6% as investors rushed into cash. As the 2008 financial crisis demonstrated, derisking occurs across the board, and no asset class is spared.
After it became clear to the markets that the tariff war was just the beginning of an uncertain morass, coupled with the President’s response on the independence of the Fed, gold resumed its upwards trajectory, and hasn’t looked back since. As of this writing, gold is up 29.1% year-to-date, continues to make new all-time highs, and shows no signs of slowing down.
It’s natural to wonder at this point whether gold is overdone and maybe due for consolidation. To find out, we looked at three metrics from CME gold futures, using OptionMetrics’ IvyDB Futures, to see if they are reaching extraordinary levels or exhibiting unusual behavior: implied volatility, the degree of out-of-the-money to at-the-money options skew, and the shape of the futures curve itself. Each can act as an informal indicator to determine if sentiment has shifted too far in one direction, possibly indicating either a slowing trend, or even a reversal.
First, implied volatility. As you can see (chart below), and somewhat counter intuitively given what’s going on and its reputation, gold trades at relatively low volatility levels compared to other commodities. Since 2005, its long-term average is only 16.8%. Implied volatility is a function of the variance of daily returns; historically, gold’s have been relatively low and stable, despite its most recent price action.
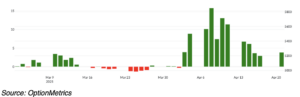
However, gold’s 30-day implied volatility is now almost a full 10 percentage points higher than it was at the end of March. Uncertainty has increased, as have price swings, so this shouldn’t be surprising.
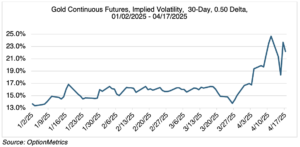
When viewed on a long-term basis, the latest increase or level isn’t that unusual:

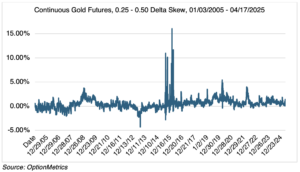
Second, gold’s out-of-the-money to at-the-money skew. Retail options investors tend to buy out-of-the money strikes because they are inexpensive in dollar terms, bidding them up in relation to the at-the-money strikes. The degree of the skew can then be used as a sentiment indicator. Like all sentiment indicators, it works as a contrary metric, but best at extreme levels.
Gold’s current 0.50 to 0.25 delta skew has averaged 0.50 percentage points since 2005. Currently, it’s about 1.30 – 1.50 percentage points. As you can see below, although the current skew is high, it is not extraordinary or unusual historically.
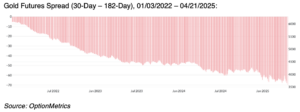
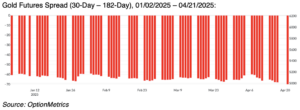
And finally, the shape of gold’s futures curve. Since gold may be stored, the futures curve trades in contango (futures prices are higher than spot). As the curve steepens, it indicates the degree to which investors are comfortable with the long-term trend. Similar to options skew, this is a contrary indicator (are investors too comfortable?), and useful only if extreme or unusual shapes are present.
Although the one month to six month curve has been steepening since the beginning of 2022 (charts below), it has been relatively stable since the beginning of the year. The spread has been widening somewhat during gold’s latest acceleration, but not suddenly or enough to merit concern.
On balance, and given the readings of the three futures indicators above, it seems that gold is behaving in an orderly manner and not exhibiting behavior that would indicate an overbought condition (at least not yet). Simply, it is responding to economic and political circumstances that are ideal for its continued appreciation.
Another factor might also be at work. Currently, gold is one of the few assets that has a clear bullish trend. If you want a workable hedge, it’s the only game in town. That might be attracting buyers from other asset classes looking for protection, pushing gold up. If the equity, fixed income, and foreign exchange markets stabilize for more than just a few days (admittedly, that seems like it could be a long shot right now), it will be interesting to see if the newcomers stick around.
A VIX Update
I finished writing my previous monthly blog, VIX Futures Term Structure: A Warning Sign?, on March 20th, and concluded that a) the VIX futures curve was displaying behavior that usually indicates bearish, or extremely unsettled, conditions, and b) since backwardation is usually associated with high VIX levels, and the VIX generally moves inversely to the S&P 500, the curve may be indicating more negative equity swings to come.
Unfortunately, the near panic over the last few weeks have proven both conclusions correct. Since the VIX is the market’s fear and anxiety index, it’s natural that it should have spiked to levels not seen since the last two significant financial crises, the 2008 great recession and the 2000 pandemic. Apparently, the “VIX is Broken” narrative, prevalent while the VIX was languishing below 20, was wrong.
How has VIX backwardation played out since late March when I last reported on it? In short, backwardation remains present (see chart below), albeit at lower levels than at the height of the panic.
Regardless, VIX futures backwardation usually does not revert back to contango quickly. During the 2008 financial crisis, it went on for about 9 months: during the pandemic, 10 months. In both periods, the SPX attempted to find a bottom (which it eventually did). Once fear, anxiety, and uncertainty become ingrained in the market, it’s difficult to get rid of them.