Although the VIX is often cited as the market’s fear or anxiety gauge, the shape of its futures curve is often overlooked. The futures term structure, or the curve displaying the relationship of different contracts and maturities to one another, is the most important feature that separates futures from other financial products. Depending upon the specific product, the overall shape of a futures price curve may be used to infer valuable information, including storage costs, supply/demand factors, or, under certain conditions, short-term market direction.
Futures curves may be described using their overall shape and slope. When nearby expirations are trading at a premium to later maturities, the futures curve will be downward sloping, or backwardated (sometimes known as inverted). The reverse — spot trading at a discount to futures contracts – is known as contango. For commodities that can be stored, that is usually the case.
For cash-settled financial products, such as VIX futures, the shape of the curve is determined mostly by sentiment, the value of the VIX index itself, and the direction of the nearby contracts. During uncertain times, or in the case of real or possible market declines, backwardation can occur because traders naturally concentrate on current market conditions and crowd into the nearby contracts, thereby bidding them up in relation to longer-term expirations.
As you can see from the distribution below, VIX futures usually trade in contango. In general, the VIX curve only moves into a backwardated shape if the market is under extreme stress and the index itself is at relatively high levels. Of all daily observations since 02/24/2006, the VIX curve was backwardated only 18.8% of the time, mostly during the financial crisis (2008-2009) or during the depths of the pandemic (March, 2020). Outside of those periods, backwardation (as shown on the left side of the chart and in negative numbers) is relatively rare.
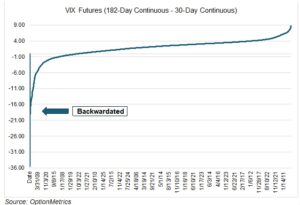
Notable high stress events (measured at the SPX low for each event) in the past show considerable VIX backwardation (as measured by the difference between 180-day and 30-day VIX continuous futures):

At the same time, periods of backwardation are usually relatively short, as VIX is a mean-reverting instrument. However, extreme events that only occur once or twice per decade, such as the financial crisis or the pandemic, may produce periods of multi-month backwardation.
The value of the VIX itself also affects the curve. This can be seen by comparing the slope of the futures curve to nearby VIX futures, as charted below:
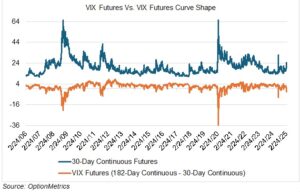
What may we infer from the current shape of the VIX futures curve? First, the curve is displaying behavior that usually indicates bearish, or extremely unsettled, conditions. VIX futures were backwardated for 10 trading days between 03/03 and 03/10, reaching 3.45 on March 10th; the last time the market was backwardated greater than 3.00 was on 10/01/2020, during the pandemic. Since March 10th, the market has moved closer to normal (contango), but not decisively so. Second, since backwardation is usually associated with high VIX levels, and the VIX generally moves inversely to the S&P 500, the curve may be indicating more negative equity swings to come.