Steep bull markets have always been accompanied by predictions of spectacular reversals. Each new high brings a fresh batch of pundits eager to point out that the market is overbought, structurally weak, or flashing frantic sell signals. Contrarian arguments are popular in that they appeal to the natural inclination to be ahead of the crowd and somehow “in the know.” Unfortunately, often the arguments are inconsistent or incomplete or suffer from confirmation bias, or the tendency to only consider supporting analysis, facts, or data.
Commentary on the VIX often falls into this trap, but it’s usually one-sided. When the VIX is relatively low, many interpret the market’s calm as complacency and warn of trouble ahead. Conversely, when the VIX is high, commentary reinforces and supports the panic and fear already dominating the market. Is either interpretation correct?
The first argument relies on the mean-reverting nature of the VIX; the second ignores it. More than 30 years of data and numerous statistical tests provide strong evidence that the VIX is mean reverting. Practical and structural forces provide effective upper and lower bounds that tend to pull the index back to average levels. VIX spikes, which are usually caused by an unexpected and significant financial or geopolitical event, usually moderate quickly as sharply higher capital requirements and extreme daily mark-to-market variance force traders out of the market. In almost all cases, panic subsides as new levels of uncertainty are priced accordingly, and daily market swings decrease. On the other end of the spectrum, extremely low VIX levels indicate a relatively complacent market with accepted levels of uncertainty stemming from known factors. Unexpected or unknown events can then cause the index to move higher to average levels.
After analyzing VIX data since 1996, it is apparent that the pull of mean reversion is real but not equal across time horizons or volatility regimes. The table below shows the percentage of trading sessions it took for mean reversion to assert itself, i.e., for the VIX to decline when it is above the specified level or rise when it is below it:
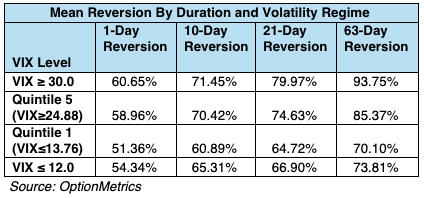
Notice the disparity in mean reversion performance between high and low volatility regimes. When the VIX is greater or equal to 30, 60.65% of trading sessions traded lower within just one day; within 10 days, it increases to 71.45%. Conversely, low VIX levels react more sluggishly to mean reversion. Below the first VIX quintile (≤13.76), the index is about equally likely within one trading day to rise or fall. After 10 sessions, the number rises to 60.89% but is still significantly lower than when the VIX is in a high volatility regime. As time increases, the disparity in the effect of mean reversion between high and low volatility regimes only grows. In short, the analysis supports the notion that the VIX tends to be sticky to the downside but slippery to the upside.
The conclusion that the VIX is asymmetrically mean-reverted is supported by a histogram of all VIX values since 1996: 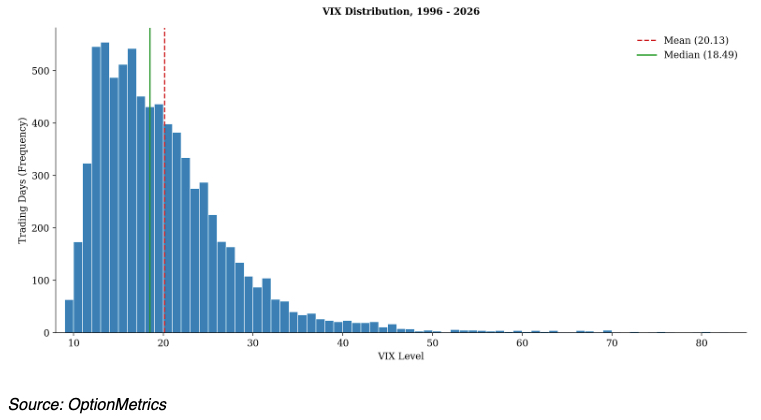
Despite persistent uncertainty surrounding the war in the Middle East and oil prices, elevated bond yields, and Fed policy, the VIX is currently in a relatively low range historically. When VIX data is arranged into quintiles, the year-to-date low of 14.25, recorded on August 14th, falls firmly within the second quintile:
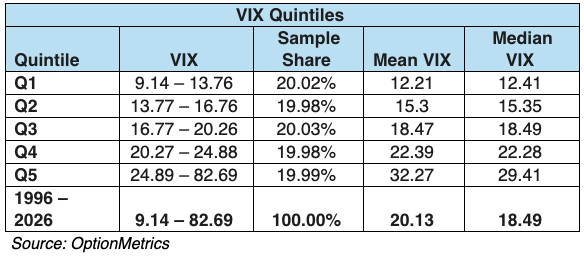
Since the VIX is relatively low compared to its overall average or median (20.13, 18.49), it’s not surprising that many contrarians are claiming that the market is overly complacent and that the VIX should increase. As we have seen, the argument relies upon mean reversion and is sound, although the timing of the reversion is unknown. Less sound is when commentators ignore mean reversion when the VIX is at extremely high levels and succumb to the panic dominating the news. As we have seen, that is when VIX mean reversion is at its highest.
It should be noted that mean reversion of trades rely upon long-term convergence, and that can often fail, and sometimes spectacularly. For example, if one implemented a simple trading program to sell the VIX when it crossed over into the 5th quintile (24.89) with a 10-day holding period, there were 155 instances since 1996 that would have qualified. Of these, the VIX continued moving up in almost 20% of the cases, the most extreme of which were during the 2008 financial crisis (212 days) and the Dot.com Crash (109 days). Conversely, if the same trading program were implemented in a low volatility regime below the 2nd quintile (13.77), there were 157 instances, of which over 22% failed, the longest one lasting 116 days.
It is easy to predict that a mean-reverting asset will return to its average and that the market will correct — eventually. More difficult is maintaining the trade until it does. Holding costs, daily mark-to-market swings, and outsized cash requirements are very real operational factors that market pundits often ignore. “The market can stay irrational longer than you can stay solvent” is a well-worn aphorism that is still true. After all, the real question in trading is not if, but when.