Two strategies appear to be dominating both retail and institutional trading in today’s market: covered call ETFs, pulling in billions of AUM, and Zero-day-to-expiration (0DTE) options, now accounting for more than half of SPX options volume. Let’s combine the two to assess potential returns for the combined pair.
0DTE options exhibit extraordinary theta decay, with time value eroding dramatically in the final trading hours. While this dynamic tempts traders to harvest premium through naked call sales, such strategies remain profitable only until they catastrophically aren’t. One CPI print or Trump tweet can devastate an unhedged account. Covered calls eliminate this tail risk by maintaining full ownership of the underlying security.
The critical decision in any covered call strategy centers on strike selection. Near-the-money options deliver larger premiums but allow for frequent assignments. Conversely, deeper out-of-the-money strikes avoid this assignment, but at the cost of meaningfully reduced premium income.
Using OptionMetrics IvyDB US – Intraday data, we backtested a systematic 0DTE covered call strategy on SPX at varying strike levels. Every day at 10am we sell a same-day expiring option, which is collateralized by the necessary amount of underlying shares. Premium is collected and positions are held through expiration. Upon assignment, we liquidate our shares and forgo overnight returns, reestablishing our position at the following day’s 10am price. Unassigned positions retain overnight exposure. All proceeds compound into subsequent periods. We tested moneyness levels in increments of 0.25%: at-the-money (ATM), and strikes 0.25%, 0.5%, 0.75%, and 1.0% out-of-the-money. If 0DTE options don’t exist on a day (mainly in 2018 and 2019), just the underlying is held.
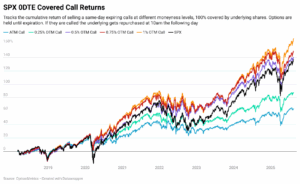
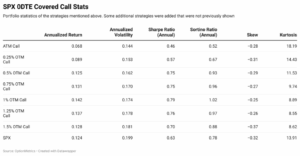
The graph above shows the cumulative returns of the aforementioned covered call strategies from 2018 to present. The corresponding table shows the summary statistics of each strategy. The empirical evidence reveals a compelling monotonic relationship between strike distance and performance. The ATM strategy underperformed significantly with 6.8% annualized returns. As strikes moved progressively out-of-the-money, returns improved systematically: 8.9% (0.25% OTM), 12.5% (0.5% OTM), 13.1% (0.75% OTM), and 14.2% (1.0% OTM)—notably exceeding the 12.4% buy-and-hold SPX benchmark.
This pattern makes economical sense, wider strikes reduce assignment frequency, thereby preserving participation in upside moves. Since assignment forces us to forfeit overnight returns, a period well-documented as contributing disproportionately to equity market gains, minimizing assignment events enhances cumulative performance. However, strikes beyond 1% OTM (detailed in the table above) collect negligible premium, causing returns to converge back toward the passive benchmark. Risk-adjusted analysis via Sharpe ratios identifies the 1% OTM strategy as optimal at 0.79.
Most strategies exhibited higher skewness than SPX, a direct consequence of premium collection cushioning downside volatility. This is clearly visible in the graph during the 2022 bear market, where the 0.75% and 1% OTM strategies experienced markedly shallower drawdowns than the index. The tradeoff is the capped upside potential, evidenced by reduced kurtosis of 9.74 and 8.89 for these strategies versus 13.91 for SPX.
A disciplined 0DTE covered call strategy can generate returns higher than the underlying when calibrated to optimal strike distances. The 1% OTM configuration balances premium collection against assignment risk most effectively in our historical sample. Future research should explore how this optimal moneyness varies across securities and volatility regimes.