Garrett DeSimone, PhD
Saugat Shrestha
The escalating takeover battle for Warner Bros. Discovery (WBD) has become a real-time case study in how market prices deal with uncertainty. Paramount Skydance’s hostile $30 per-share cash bid—launched after WBD moved forward with a lower-valued agreement with Netflix—has introduced a second, materially different path for shareholders, each with distinct financing structures and regulatory risk.
For options traders, episodes like this are special because buyout situations introduce binary payoff structure: either the deal closes near the offer price or it collapses back toward the pre-bid standalone value. Options markets reflect this directly by pricing a mixture of two states of the world. The probability of a bid succeeding or failing can be inferred from option prices through the risk-neutral distribution, which reflects the market’s implied likelihood of different price outcomes at maturity. At a high level, we extract these implied probabilities as follows:
- Construct a standardized volatility surface using OptionMetrics’ proprietary arbitrage-free methodology.
- Fit the strike dimension with a spline to generate a continuous set of strikes.
- Apply the Breeden–Litzenberger approach to recover the implied probability density for each strike.
Below we provide the surface for the WBD option chain on 12/10.Upon inspection, this is an atypical surface. In most equities, implied volatility is convex overall but exhibits a downward-sloping right tail as strike increases. In contrast, this surface shows pockets of local convexity and non-monotonic behavior across strikes—features that are characteristic of markets pricing discrete, binary outcomes such as buyouts. In simpler terms, the market is treating some price levels as much more likely than others, rather than spreading probability smoothly across all possible prices.
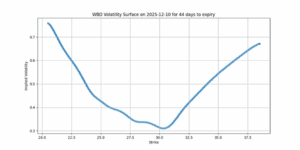
Source: OptionMetrics
In the chart below, we extract the probability distribution of prices from WBD. The risk-neutral PDF exhibits a clear bimodal structure, with the highest probabilities concentrated around a lower mode and an upper mode. Financially, this reflects the market assigning weight to two distinct states of the world: if the buyout collapses, WBD is expected to revert toward the lower standalone valuation, while a successful deal would pull the stock toward the higher offer price. In takeover scenarios, the distribution stops looking “continuous” and instead resembles two modes.
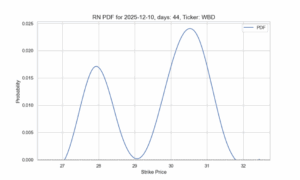
Source:OptionMetrics
The upper mode sits around $30.50, implying the market is pricing in a modest bidding-war premium of roughly 50 cents above the current offer. On the downside, if Paramount’s hostile bid ultimately fails, the stock is expected to fall back toward pre-hostile bid level near $27.75. By summing the risk-neutral probabilities across prices, we can also infer the market-implied likelihood of deal success: probabilities assigned to outcomes below $30 correspond to failure, while probabilities above $30 correspond to a successful transaction.
Paramount’s takeover remains far from a certainty, with the market assigning a deal-success probability of only about 57.3%, leaving a sizable 42.7% implied chance of failure.
In sum, the WBD takeover battle illustrates how markets can price binary events in real time. The volatility surface and resulting risk-neutral distribution show the market effectively weighing between two outcomes: the deal closes or it doesn’t. Examining where the probability mass sits provides a fast and analytical read on deal odds. Short-dated options are particularly informative in these situations, as their surfaces react most sharply to shifting risk, which is only visible with proper methodology and reliable data.