By: Garrett DeSimone, PhD and Anton Rotach
Trailing dividend yield is one of the most widely used signals in equity investing. It is also, by construction, backward-looking. It tells you what a company paid in dividends over the last twelve months. It says nothing about what the company will pay next quarter. For income-oriented investors and dividend-focused strategies, that distinction matters enormously — deteriorating payout capacity tends to be invisible in trailing yield data until the cut is announced, at which point the repricing has already happened.
Implied Dividends: The Basics
Single-stock options are implicitly forward contracts on the dividend path of the underlying. Cash dividends accrue to shareholders, so upcoming payments directly affect the relative pricing of calls and puts at matching strikes. This means the options market must continuously embed a view on future dividend trajectories.
IvyDB DividendView provides implied dividend yield estimates on U.S. single name securities. Our methodology solves for implied volatility and dividend yield simultaneously across matched call-put pairs using Cox-Ross-Rubinstein (CRR) binomial trees — an important detail for single-name U.S. equities, where American-style early exercise optionality can distort naive put-call parity estimates, particularly for high-yield names and in elevated rate environments. Additionally, yields are Kalman-smoothed across the ex-date term structure and interpolated to a consistent 90-day horizon to make the cross-section comparable across firms with different dividend timing conventions.
The signal we utilize to understand the divergence between option yield expectations and realized is the the implied dividend gap:
Implied Dividend Gap = Implied Yield − Realized Yield
Trailing realized yield reflects what the firm has paid; implied yield reflects what the options market expects it to pay. When the two diverge, it is because the options market is pricing in a dividend trajectory that the trailing yield has not yet reflected.
In the case of a negative gap: the options market is pricing in a near-term dividend trajectory below recent payout history. For a Positive gap: above-trend growth is already embedded in options prices — and by extension, already capitalized into the stock price.
Does the Signal Actually Predict Cuts?
The credibility of the implied gap as a risk signal rests on a testable premise: if the options market is genuinely incorporating forward-looking information about payout trajectories, Low Gap stocks should subsequently cut dividends more frequently and more severely than High Gap stocks.
Each month, we sort our universe of optionable, dividend-paying U.S. equities into deciles on the implied dividend gap. The table below reports realized dividend change statistics for the next dividend paid within 90 days for the extreme portfolios — High Gap (P1) and Low Gap (P10) .
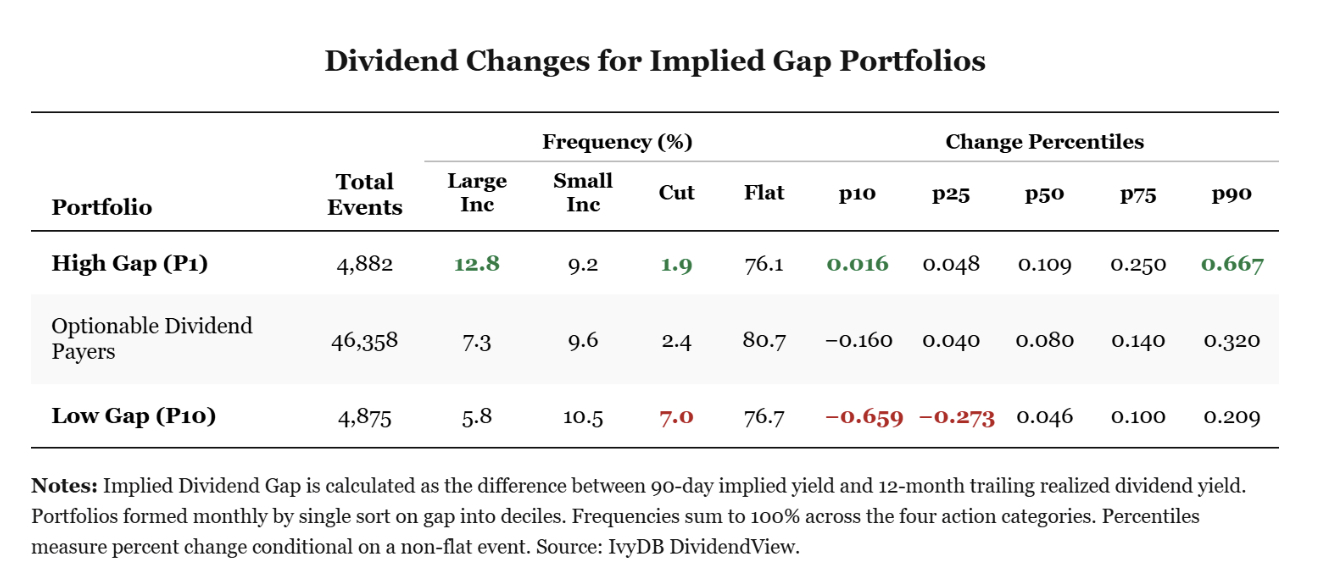
The results are unambiguous. Low Gap stocks cut at a 7.0% rate — roughly 3.7x the 1.9% rate for High Gap stocks and nearly 3x the 2.4% universe baseline.
Analyzing the size of the changes, the median non-flat change is only +4.6%, well below the +10.9% median for High Gap stocks and +8.0% for the universe. The left tail of the Low Gap distribution is not populated by modest trims — these are material payout deteriorations. High Gap stocks show the mirror image: a large increase in frequency of 12.8%, more than double the universe rate, and an almost entirely right-skewed non-flat distribution. The options market’s forward view is, on average, correct.
What This Means in Practice
Standard dividend risk frameworks — payout ratios, earnings coverage, leverage screens — are useful but inherently coincident with or lagging fundamental deterioration. Options markets aggregate information continuously from a broad participant base, including those hedging dividend exposure through structured products. The result is a real-time, price-based signal of forward payout risk that updates faster than accounting data and, as the table above shows, contains genuine predictive content about future dividend outcomes.
The implied dividend gap signal is derived from IvyDB DividendView, OptionMetrics’ options-implied dividend database covering U.S. single-name equities. Portfolios formed monthly by single sort on gap into deciles. Past performance is not indicative of future results.