Lance Zhao, OptionMetrics
Garrett DeSimone, PhD, OptionMetrics
Introduction
Dividends are crucial in stock investment, providing regular income and indicating a company’s financial health. Our event study on dividend announcements shows that stocks with increased dividends generally yield higher returns, while those with dividend cuts experience lower returns on average. We also present a use case in dividend policy prediction for OptionMetrics’ latest product, IvyDB Implied Dividend, which uses options pricing data to provide forward-looking dividend projections.
Event Study
In US markets, many firms exhibit policies of dividend smoothing, or a preference towards stable dividend payments throughout time. Often, this means the dividend stream will appear as a pattern of predictable seasonal increases. However, there are important exceptions. Firms that experience strong profitability growth will often raise dividends above analyst expectations, and companies in dire financial straits will often cut or suspend them. A dividend cut is defined as a decrease of 3% or more in the declared dividend compared to the previous dividend; a raise as an increase of 2% or more, and other cases where dividends remain stable can be defined as flat. We utilize this classification approach to focus on economically significant changes in dividend policy, as opposed to payments that follow the normal smoothing pattern. It results in a dividend change distribution that aligns closely with the literature we reference.
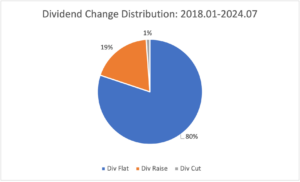
Analyzing historical dividend distribution data from OptionMetrics, we find that from 2018 to 2024, 80% of dividend announcements hold the dividend flat, 19% raise the dividend, and 1% cut the dividend.
Source: OptionMetrics IvyDB US
For the 20% of cases that exhibit a meaningful change in dividend policy, there is a clear impact on short-term stock performance. Using options data from IvyDB US, we conduct an event study for dividend announcements under the universe of S&P 500 stocks. We study cumulative stock returns immediately following the dividend declaration announcement, group them into three groups (dividend flat, raise, and cut), and evaluate their performance over five-day and 10-day horizons immediately after the dividend declaration dates.
Source: OptionMetrics IvyDB US
We summarize the number of observations, averages and standard deviations of holding period return for those three groups in the table above. With a five-day horizon, average holding period return for dividend raises is 0.79%, the highest among the three cases. Average return for dividend cut is the lowest at -1.48%. When it comes to volatility, dividend raise and flat are close, and they are both lower than dividend cut. This pattern holds when we extend the holding period to 10 days.
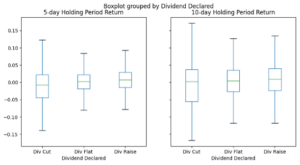
We can also visualize distribution of holding period return in a boxplot to show a summary of the distribution of the data. The box body represents the IQR (interquartile range), containing 50% observation. The lower edge is the first quartile, below which 25% of observation falls. The upper edge is the third quartile, above which 25% of observation falls. The green line in the middle of each box represents median holding period return. We can see the green line is moving up from dividend cut to dividend flat and finally to dividend raise. Also, the spread between whiskers is the largest for dividend cuts, indicating high volatility. These results demonstrate significant value in correctly predicting dividend actions.
Classification of Dividend Increases and Cuts
Given the importance of dividend news on stock returns, we are interested in testing whether IvyDB Implied Dividend has predictive power for changes in dividend policies. Two years prior to the forecasted ex-date, our models calculate a daily implied yield and implied amount projections from listed dividends.
While we calculate implied yields based on the projected ex-date, the declaration date is the true informational event since it officially confirms the companies’ dividend payments. In most cases, prior to the declaration date market participants cannot guarantee an upcoming dividend payment with 100% certainty.
Our simple test involves averaging the previous 30 days of observations immediately prior to the declare date., We compare this test with the previous dividend paid
and conduct two additional hypothesis tests using t statistics with significance level of 5%. Both hypothesis tests are one-tail. This can be stated as:
If the null hypothesis is rejected, we predict a dividend cut in the incoming ex-dividend date. If null hypothesis is not rejected, we proceed to the second hypothesis test.
If this time the null hypothesis is rejected, we predict a dividend raise in the incoming date. If the null hypothesis is not rejected, it means there is not strong enough evidence for a dividend change, so we predict dividend flat.
Classification Logic in Decision Tree
From January 1, 2018 to July 31, 2024, our model achieves a recall of 61% in “Dividend Cut” and a recall of 56% in “Dividend Raise”. In other words, this simple model can correctly forecast 61% of cuts and 56% of raises prior to the official announcement.
Successful Classification Cases
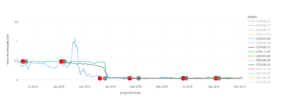
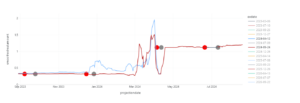
Here we share four successful examples of our model. In the charts below, white bubbles represent the annualized dividend declared amounts, and red bubbles are the annualized dividends paid on ex-dividend dates for Walgreens Boots Alliance, GE Aerospace, and Morgan Stanley. Series with different colors are implied dividend projections of different terms.
Walgreens Boots Alliance 2023.08-2024.05 dividend distribution & projection
Source: OptionMetrics IvyDB Implied Dividend
Walgreens (ticker: WBA) cut its dividend from $1.92 to $1 in January 2024. Our average projection is $1.75, 9% lower than the previous dividend paid. Our model flagged it as cut in advance.
GE Aerospace 2018.06-2019.05 Implied dividend distribution & projection
Source: OptionMetrics IvyDB Implied Dividend
GE Aerospace (Ticker: GE) cut dividends from $0.48 (September 2018) to $0.04 (December 2018). Our average projection is $0.50, 43% lower than the previous dividend paid. Our model correctly forecasts this cut.
GE Aerospace 2023.09-2024.08 Implied dividend distribution & projection
Source: OptionMetrics IvyDB Implied Dividend
GE Aerospace increases dividends from $0.32 (December 2023) to $1.12 (April 2024). Our average projection is $0.50, 57% higher than the previous dividend paid. Our model correctly predicts this rise.
Morgan Stanley 2021.01-2021.11 dividend distribution & projection
Source: OptionMetrics IvyDB Implied Dividend
Morgan Stanley (Ticker: MS) doubles its dividends in July 2021 from $1.4 to $2.8. Our average dividend projections are $1.68, 20% higher than the previous dividend paid. Thus, our model captures this dividend rise before the declaration date.
Final Thoughts
This research underscores the significance of dividends in stock returns, emphasizing their role in providing regular income and signaling a company’s financial health. Through an event study on dividend announcements, it was found that stocks with increased dividends generally yield higher short-term returns, while those with cuts experience lower returns. The study also highlights the predictive potential of OptionMetrics’ new product, IvyDB Implied Dividend, which shows promising accuracy in forecasting dividend cuts and raises before official announcements. The findings suggest that accurate prediction of dividend actions can offer significant value to investors, reinforcing the importance of dividend-related insights in investment strategies.


