The latest hostilities in the Middle East between Israel and Iran have obvious and significant implications for crude oil futures and implied volatility. Although Israel’s initial strike was anticipated before the attack, it came as a surprise to the market and caused an immediate 7.3% jump in price (WTI, July contract) as well as a 7.1 percentage point increase in its implied volatility. If not for US involvement and the current ceasefire, the result could have been potentially explosive.
Regardless, how did the move in crude oil compare to previous oil price shocks? To find out, we compiled the daily price and volatility behavior of 30-day continuous price crude oil futures (WTI) since 01/03/2005. We then ranked the 20 most positive and negative results and compared them against what occurred on the first day of the war (06/13/2025):

As you can see, although the daily price and volatilty changes on the first day of the war (in bold) were significant, they are considerably less than what occurred during previous geopolitical and financial shocks. As a matter of fact, out of 5122 total observations since 01/03/2005, the price change on 06/13/25 was only the 39th largest. Similarly, the change in implied volatility was the 47th largest.
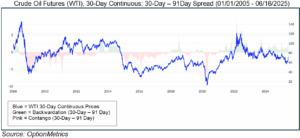
We also reviewed the shape of the current crude oil futures curve to see how it compares to previous shapes. Depending on prevailing supply/demand conditions, crude oil futures curves may be in either contango (positively sloping), or more commonly, backwardation (negatively sloping), and may shift from one to the other. In rising markets, crude tends to be backwardated; in falling markets, in contango. In some instances, the curve may include elements of both.
As you can see below, crude is currently backwardated, but not to an extraordinary or extreme degree, such as was seen in 2022:
One measure on 06/13/2025 was extraordinary: vol skew. On that date, there was a rush into out-of-the-money calls as traders were positioned for an expansion of the war. As a result, the skew roared to near record levels. Using 0.50 delta at-the-money options and 0.25 out-of-the-money options to calculate skew, the reading on 06/13/2025, 13.73 percentage points, was the third largest since 2005.
Although the Israel/Iran war is still evolving, we can draw some preliminary conclusions:
- Considering the various metrics we employed, the war’s effect on price and implied volatility to date has been significant, but much less so than in previous geopolitical and financial events. Changes in return, implied volatility, and curve shape do not indicate an extraordinary event (so far).
- The early pandemic period dominates the top 20 daily return and volatility change rankings since 01/03/2005. For return, 42.5% of the top 20 daily increases and decreases occurred during the pandemic; for volatility, 57.5%.
- As the initial shock of the war wears off, the rate of change of both crude oil price and implied volatility, as well as the degree of backwardation, will moderate unless the situation intensifies. Two wars involving energy this decade, the war in Ukraine and the war in Gaza, did not result in any significant supply disruptions. Global supplies are currently ample. Although the war directly involves an oil producer, traders are wary that a shortage will finally occur this time.
- A more significant, longer lasting, and broader shock will require the geopolitical situation affecting energy to migrate to other asset classes. For example, if crude oil explodes to over $100 due to the war, the potential inflationary effect may force the Fed to reconsider any possible interest rate cuts. A more systemic shock to all asset classes, and not just energy, could then be forthcoming.