With OptionMetrics’ new IvyDB Implied Dividend product, a lot of deep-rooted analysis can be conducted regarding future expectations of dividend payments. One area of particular interest in asset pricing and factor applications is comparing the option implied yield to the realized actual yield and extracting implied dividend growth. In this post, we’ll explore what dividend risk premiums are, how they can be calculated using implied dividends, and why they matter to investors.
The dividend risk premium (DRP) represents the additional return that investors demand for bearing the risk of uncertain future dividends. According to theory, dividends extracted from the options market represent risk-neutral dividends. Therefore, the present value of future dividends extracted from options is represented by the growth of future dividends is discounted by a risk premium and a discount rate. Kragt provides a formula that allows us to solve for the implied dividend growth:
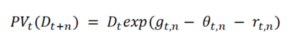
It says that the present value of a dividend expected to be paid at time n, PVt(Dt+n), is a function of current dividends, Dt, the expected dividend growth rate, g, the dividend risk premium, 𝜃, and the risk free rate, r. Solving for the implied growth rate, we get:
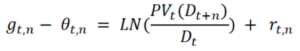
This formula represents the implied growth rate, which includes the expected growth rate and the dividend risk premium. However, a more serious use case might require an isolation of growth rate for each individual security in order to focus on solely 𝜃, the risk premium.
Since the OptionMetrics IvyDB Implied Dividend product provides an implied dividend amount per each ex date of a company, we can build a term structure of the implied growth rate to observe its behavior as time varies. Naturally, this term structure should be sloping upwards, as investors expect future dividends to grow. The chart below shows the average implied dividend growth of all constituents in the SP500 since 2018. The 30 day and 1 year dividend risk premiums are graphed separately.
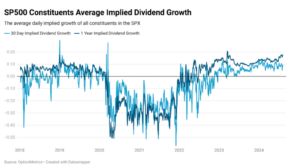
Outside of 2020 and 2021, the implied growth is generally positive as dividends are expected to grow under normal market conditions. The 1 year growth is higher than the 30 day DRP as expected, providing that upward sloping term structure.
In 2020 and 2021, DRP is very high resulting in a negative implied growth, indicating that investors are placing higher probabilities on dividend cuts. The implied growth curve inverts during this time, as 30 day growth is higher than 1 year growth. This inversion indicates long term caution, as investors do not believe the current dividends are sustainable over the long term and are putting a higher premium on near-term cash flows. This inversion is a good indicator of the overall market uncertainty. Inversions on a security level could signify company-specific uncertainties.
The ability to extract and analyze the implied dividend growth from OptionMetrics’ IvyDB Implied Dividend product provides a powerful tool for understanding market dynamics and company prospects. By leveraging this data investors can gauge market expectations for dividend growth and identify potential uncertainties through term structure inversions. Tracking the slope of the implied dividend growth term structure over time could prove to be lucrative and is worth exploring in a factor portfolio strategy.
Kragt, Jac, Option Implied Dividends (June 2, 2017). Working paper, Available at SSRN: https://ssrn.com/abstract=2980275 or http://dx.doi.org/10.2139/ssrn.298027