Last week’s random meme stock resurgence put another wet blanket on the efficient market hypothesis. The catalyst for this latest run was a Sunday night tweet from one of the original characters of the OG meme stock craze of ’21, Keith Gill, aka “Roaring Kitty.” After going dark for nearly three years, Gill posted a picture on the X platform of a video gamer leaning forward in his chair.
The market response for GameStop (GME) on Monday morning, May 13, was manic. GME popped over 25%, from $17.46 to $26.34, at the market open. On May 14, the stock continued its streak, opening over 100% higher from the previous close at $64.83. However, by May 15, this rally had fizzled. Lasting far shorter than its 2021 predecessor, GME opened near $40 and has not reached the previous high since.
Interestingly, nearly all of GME’s excess returns during this period were generated overnight. Given that the highs for both days occurred within the first hour of trading, we explored the options market volume activity up to 11 a.m. on May 13 and May 15.
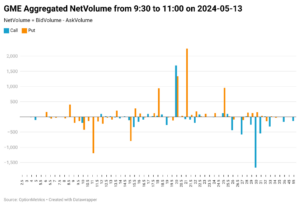
Our dataset utilizes IvyDB Signed Volume intraday to aggregate call/put dealer volume across the spectrum of strikes. This is achieved by categorizing market maker buy orders as near-bid trades and sell orders as near-ask trades. The chart below displays Net Volume (Bid-Ask) for market makers on May 13.[1] It’s important to note that the other side of the trade represents end-user demand or investors in options outside of liquidity purposes.

The most significant observation is the number of sold call contracts by market makers in the ATM call space. A net 1,600 contracts were sold at the 30 strike, representing 1,600 contract purchases by end-users. There are also comparably sized short trades (end-users long) in the OTM put space centered around the 11 strike. Interestingly, it appears market makers had significant long inventory around the $20 strike range.
This analysis reveals that at the start of the rally, market makers had significant net short positions on OTM options and large net long positions near the pre-catalyst price ($20) of GME. In our view, this points to a group of investors seeking vol premium exposure due to massively inflated premiums. It also indicates demand for convexity in the form of OTM options.
The chart below demonstrates the May 15 volume distribution at 11 a.m. Across a majority of strikes, market makers are net long calls. This is especially true at the 11 strike, which had a whopping 12,000 contracts purchased. Although, there is some indication of hail-mary investor call purchases of approximately 2,000 contracts at the deep OTM 99.5 and 100 strikes.
These findings indicate that options sentiment had clearly tilted towards downside price movements, as OTM call demand by investors had mostly evaporated. This episode underscores the inherent value of mapping directional options activity across the full spectrum of strike space.
[1] Our aggregation of option volume accounts for options expiring less than 30 days.
Written by:
Garrett DeSimone, PhD
Oscar Shih
