Over the last few months, there has been a steady chorus of traders and social media commentators claiming that the VIX is somehow “broken,” i.e., the index no longer responds adequately or sufficiently to economic crises, market movement, or sentiment. The evidence provided for this opinion is varied, but usually centers on the VIX’s performance during the two most recent financial crises: the war in Ukraine and the regional banking crisis. In my view, this is a superficial perspective and the VIX continues to accurately reflect market conditions.
Of course, “broken” is a subjective (often overused) term. What could be the symptoms that could indicate that the VIX, or its related futures contracts, are “broken” or irrelevant? A sampling of the reasoning behind this from some pundits, includes:
- The historical drivers of the VIX, such as its relationship to the risk premium (i.e., the VIX – SPX historical volatility) or daily changes in the SPX, are behaving erratically or are no longer correlated to the index or its futures
- The tendency of the index and its risk premium to mean revert is no longer true
- Random movement in the VVIX (the volatility of the VIX), unrelated to market conditions
- VIX futures volume and open interest declining, especially in the front month
As we shall see, none of these conditions exist and the VIX continues to be a relevant indicator of implied volatility and market sentiment. Let’s review each of the statements listed above.
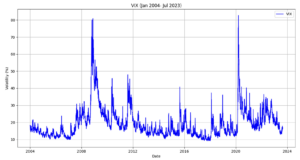
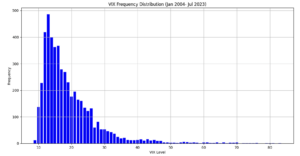
First, it should be noted that extreme movements in the VIX are rare and occur less often than may be popularly perceived. The VIX frequency distributions below indicate that of 4,926 observations since 2004, only 8.3% were above 30, 3.4% above 40, and 1.5% above 50. The probability of extreme movements should not be overestimated, as indicated in the charts below, showing their rarity.
Source: OptionMetrics
Source: OptionMetrics
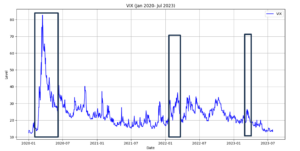
Similarly, recent crises and market shocks, such as the war in Ukraine and the regional banking crisis, have been relatively short-lived. In the case of the latter, the fixed income market was more concerned than the equity markets. Apparently, sustained upwards movement in the VIX tends to require longer duration crises that primarily affect the equity markets.
Source: OptionMetrics
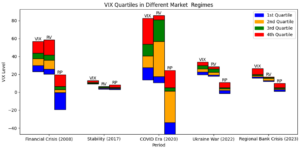
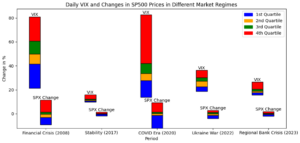
In addition, quartiles of realized volatility, risk premiums, and daily changes in the SPX, expand during crises. As you can see in the displays below, their quartiles did not expand, and in fact remained relatively tight, during the last two crises, indicating that a VIX spike was not merited.
Source: OptionMetrics
Source: OptionMetrics
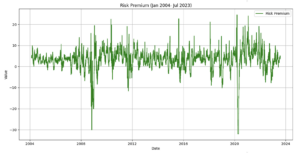
Regarding the risk premium itself, it follows a mean reverting process historically, since both the VIX and realized volatility are mean reverting. If the VIX was behaving abnormally, one would expect this not to be the case. However, it remains within normal bounds and continues to be mean reverting:
Source: OptionMetrics
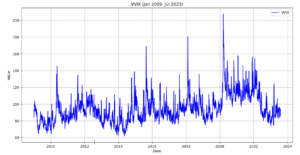
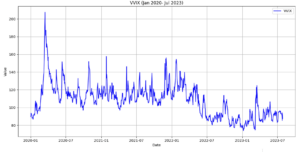
Nor does the VVIX provide much help to the VIX’s critics, recent VVIX results, or the volatility of the VIX, can be misleading. As can be seen in the charts below, higher VVIX means and medians since 2020 indicate higher VIX volatility. However, that does not necessarily mean the absolute level of the VIX should increase. This might be leading some to believe that the VIX “should” be higher than it is, thereby concluding that it is somehow ”broken.”
Source: OptionMetrics
VVIX (2009-2019): Mean: 90.02 Median: 88.61
Source: OptionMetrics
VVIX (2020-2023): Mean: 108.35 Median: 108.99
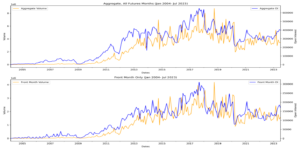
Finally, VIX futures volume and open interest do not indicate a dying contract.
Source: OptionMetrics
A short comment on 0DTE options and their effect on the VIX. Many commentators have focused on the growth of 0DTE options and how they may be affecting the SPX, and by extension, the VIX. To be clear, 0DTE options are those that have one day until expiration and those that exist for just a single trading session. In both cases, the connection to the SPX is due to the extremely high gamma of 0DTEs and the consequent effects of sudden hedging in the SPX. However, although their connection to the SPX is clear, their effect on the VIX is less so.
As we have seen, two conditions must be met before the VIX can be affected on anything other than a short-term basis:
- Daily SPX price moves must be large enough and sustained over multiple trading sessions, not just the result of a short term 0DTE gamma squeeze that affects the SPX
- Additionally, the VIX measures 30-day volatility, not 1-day volatility, as is relevant for 0DTE options. Consequently, an event that could significantly affect the VIX must be one that is perceived to influence the market’s perception of 30-day implied volatility. In other words, the triggering event must be deemed long-term in nature. As we have seen earlier, sustained upward moves in the VIX require longer duration crises.
Therefore, 0DTE options can affect the SPX due to their high gamma nature, but require that certain extreme conditions be met before they can affect the VIX on a long-term basis.
However, that is not say that they can never affect the VIX significantly. Under certain extreme conditions, a “doom loop” scenario could unfold: (a) abnormal price movements could occur due to an unexpected, extremely low probability event, or (b) market makers and other sellers of 0DTE options could then rush to hedge their high gamma positions, selling into a declining market and thereby amplifying the downward price spiral. A rush to the exits and a market crash could then result. Unintended consequences can never be ruled out, however low their probability.
Regardless, and as we have seen, the VIX has been reflecting conditions that naturally lead to lower implied volatilities. Just because the VIX has not moved as expected by certain traders and observers, does not necessarily mean that the index is suddenly irrelevant or “broken.” Whether analyzing the VIX’s historical risk premium, quartiles in different regimes, or volume and open interest, as well as the VVIX, one can reach the same conclusion: the VIX is not broken and remains a relevant and accurate indicator of implied volatility and market sentiment.
