The Put/Call (PC) ratio is a very common indicator that traders use to measure investor sentiment. Given their highly publicized use in trading strategies, using put/calls as a signal to generate excess returns can be near impossible. In today’s market, generating alpha requires unique factors and strategies. Let’s replicate a basic put/call strategy and improve on it using OptionMetrics data.
The simplest form of the PC ratio is the proportion of put trading volume to call trading volume. PC values below (above) 1 are traditionally classified as bullish (bearish) since more calls (puts) are being traded. Thus, a simple strategy would be to buy securities with low ratios and sell those with high ratios in an to attempt to capture the spread between the two groups. However, this logic may be flawed since this indicator does not classify option volume as purchases or sales. In other words, a low put ratio is not truly bullish if call volume consists mainly of option sales.
To make the PC ratio more informative, we can leverage OptionMetrics’ IvyDB Signed Volume, which classifies option volume as either buyer or seller-initiated, depending on where the trade executes in relation to the bid-ask spread. If we only focus on trades occurring closer to the Ask (purchases), we can create a more informed PC ratio by taking the proportion of total put purchases to total call purchases. We will call this PC buy ratio.
We will use these two PC ratios separately to construct portfolios and back-test them from 2016 to 2022. The universe consists of all optionable securities within our IvyDB product. In order to reduce noise, stocks are required to have a price of at least $5 and have a total buyer-initiated volume of 500. Portfolios are rebalanced monthly on the first trading day of every month, based on the average PC ratio of the previous 5 days. On each rebalance date, the universe will be sorted and only the top and bottom deciles will be used to form portfolios. The returns of these portfolios are weighted by market cap to reduce the volatile effects of small cap securities.

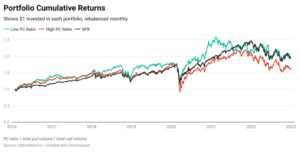
Graph 1 shows cumulative returns of $1 invested in the portfolios created from the simplest form of the PC ratio. The top decile will be called High PC ratio and would be the short leg of a potential Long/Short portfolio while the bottom decile will be called Low PC Ratio, which acts as the long leg. As expected, the portfolio of low PC ratio stocks outperforms the portfolio of high PC ratio stocks (11.2% vs 8.6% returns). It is highly likely any alpha from this basic strategy has been arbitraged out, which explains the weaker Sharpe Ratio of the bullish portfolio compared to the S&P 500, and a 5-factor alpha near-zero.

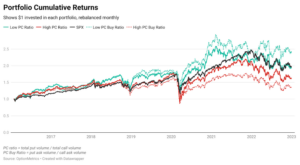
Graph 2 overlays the portfolios created using our enhanced PC buy ratio. The low PC buy ratio’s (bullish) annualized returns significantly improve over simple PC ratio (15% to 11.1%). The new strategy maintains a similar volatility profile resulting in an increased Sharpe Ratio to 0.73, which exceeds that of the S&P 500. For the high ratio portfolios (bearish), annualized returns significantly decline from the simple PC ratio to the PC Buy ratio (8.6% to 6%). If an investor were to consider a long/short portfolio construction, using the enhanced metrics yields an additional 2.6% annualized return from the short leg. It is also important to note that the alpha has improved in both PC Buy Ratio portfolios compared to their simple PC ratio counterpart.
These results show us that there is added value when leveraging signed volume to reconstruct the Put/Call Ratio. The simple PC Ratio, considered to be a common indicator to gauge sentiment, fails to account for purchases or sells. This traditional measure is modified by using OptionMetrics IvyDB Signed Volume dataset to proxy buyer-initiated and seller-initiated volume to construct our PC Buy ratio signal. As a result, both the bullish and bearish portfolios perform better because of this superior signal.

