In the final week of January 2022, the equity market experienced jaw-dropping intraday price whipsaws. On Monday, January 24, 2022, the S&P 500 saw a midday reversal of nearly 200 points, ending nearly flat to the open.
What could have caused these recent large market swings? That is the topic of a recent article in RISK Magazine titled, “Vanna and the Big Put: Unusual Suspects in a Market Mystery,” of which OptionMetrics is included. Following is our take on the stock market sell-off on January 24th that “materialised and then vanished like a crime without trace.”
As noted in this article, many have speculated on the cause—expiring options, to major put selling, to buying-the-dip—that seems to have caused a tidal wave of dealer hedging with the erratic ups and downs of the market on January 24th on no news. While some also may speculate that the popularized gamma gravity contributed to these recent, large swings, we feel it is an unlikely contributor.
In fact, it is our view that instead large negative dealer exposure to vanna was likely an influencing factor in the market behavior beginning January 24, 2022.
Vanna represents how the portfolio delta changes with respect to changes in implied volatility (IV). During calm markets, vanna typically isn’t a large concern to dealers, since small changes in implied volatility do not cause large changes in portfolio delta. For a delta hedger, small changes do not require significant buying or selling of the underlying.
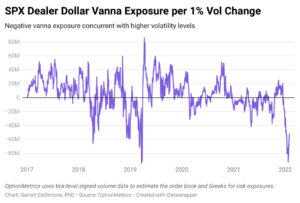
Vanna exposure tends to take on importance when markets become illiquid. A negative vanna reading indicates that as volatility increases, the portfolio delta becomes more negative. Negative vanna is volatility exacerbating; even a small decrease in implied volatility increases the dealer delta, forcing dealers to sell the underlying to remain delta-neutral. This causes a volatility feedback loop, whereby selling induces a rise in IVs. In turn, this dynamic fuels subsequent buying due to dealer delta falling. Negative vanna would, therefore, be responsible for the roller coaster price movements the equity markets experienced that week. This is supported by the chart from OptionMetrics below, showing the lowest recorded dealer vanna since 2017, reading at a level of -$93 Million per 1% change in volatility on January 24, 2022.

Whipsaws, such as the one we saw this January 24th, tend to occur when there is a small temporary easing in risk (such as with the Fed making a news announcement confirming market beliefs). A drop in IV tends to cause selling due to the fact that dealer delta increases which induces violent selloffs.
On the flip side, vanna positive environments can propel big rallies. One example is the vanna positive level heading into the 2020 election, when, after geopolitical risk eased vix levels, vanna appears to have caused hedgers to step in and buy en masse.
For more information on calculating vanna and other dealer exposures with options data, please contact us at info@optionmetrics.com.