The energy sector has been hammered in the combined wake of OPEC’s failed output deal and plummeting demand for oil as a result of Covid-19. Oil futures have gone negative, to establish a whacky super contango precedent.
This crash in prices is a death blow for highly leveraged oil companies. The bankruptcy dominoes have already begun to fall, with Whiting Petroleum and Diamond Offshore earlier this month. A common fundamental approach to determining long term viability in this environment is breaking down accounting metrics, such as Debt-to-Equity or EBIT/Net Interest. However, we can apply more forward-looking measures to this problem, vis-à-vis the option market.
Implied volatility (IV) represents the market expectation of future volatility over a given horizon. IV typically varies across strikes, and with out-of-the-money puts and calls taking on larger values, forming the famed “smile.” The overall steepness of the smile provides valuable sentiment regarding the tail risk of a firm. As perception of downside risks increase, option traders raise the price of put insurance.
There is also a well-documented relationship between default probability and volatility smiles a la the Merton Model, where equity can be modeled as a European call option on the company’s assets. Through finance identities, this leads to the fact that as an increase in the smile’s steepness, credit risk of the firm becomes higher.
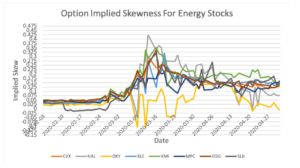
The graph below plots the implied skew for several major energy stocks, along with the SPDR Energy ETF (XLE) at a fixed 122 maturity. This skew measure is calculated as the IV difference between the 25 delta put and 25 delta call, and is an indicator of the risks of downside movement vs upside.

Source: OptionMetrics
The run up in skew is evident in the energy sector with crude prices hitting rock bottom in mid-March. Recently, many have leveled out near 13%. These oil players actually have a strong commonality, they are all in the top 10 weighting of XLE. This result is suggestive that Chevron (CVX), Kinder-Morgan (KMI), Marathon (MPC), EOG Resources (EOG), and Schlumberger (SMB) all face a similar level of downside risk connected to oil prices. The skew also indicates that none of these firms face nearly the same level of bankruptcy jeopardy in the intermediate future.
Surprisingly, Occidental (OXY) and Halliburton (HAL) exhibit significantly flatter skews because of looming issues for OXY regarding a large debt burden from a questionable acquisition of Anadarko. However, the options prices imply that the tail risk to OXY matches levels prior to the onset of the crisis. This is possibly a result of cost-cutting measures, such as massively slashing the dividend. HAL is in a similar situation, since it carries a significant long-term debt burden.
The implied skew provides an interesting contrast to risk derived from accounting measures. On paper, the debt loads of OXY and HAL would appear to make them riskier than less capital constrained firms, like CVX or EOG. However, some aspect of OXY and HAL’s operations (I am not going to venture at which part) have created less downside risk than the major constituents in XLE.