The market has seen some wild moves over the last month, which has drawn parallels only to the price action at the onset of the Great Depression. Several pundits are willing to blithely attribute this environment to some form of derivatives dealer behavior with minimal economic intuition. The goal of this introductory post is to enlighten readers on some derivatives mechanics at play here using some (light) quant intuition.
For context, gamma in options world is the second derivative of the options price with respect to a change in the underlying (similar to acceleration for the physicists out there). Over the years, institutional investors have become increasingly drawn to various vol targeting and yield enhancement strategies. This yield enhancement is achieved through downside put selling or upside call selling, which are short gamma.
Dealer Positioning
Dealers are on the other side of these trades absorbing short institutional put and calls and hedging by taking the opposite side in futures or underlying stock. When dealer gamma imbalance is heavily long, it acts to dampen volatility. This is because dealer/hedgers will buy into highs in order to keep their books delta-neutral. Long gamma begets low volatility and low volatility begets long gamma…
“Nobody panics when things go ‘according to plan.’ Even if the plan is horrifying!” ― The Joker (The Dark Knight, 2008)
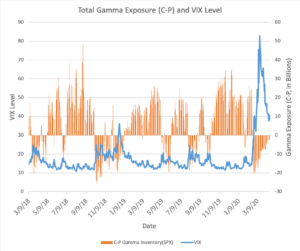
A short gamma environment is certainly more chaotic. When dealer gamma profile vaults to short puts, hedgers must sell futures or stocks deeper into lows. This is exacerbated by vol-targeting and passive fund deleveraging. Given this dynamic, volatility levels accelerate quickly. Figure 1 highlights this by showing the relationship between Call-Put Gamma Dollar exposure (per 1% move, in billions), and the VIX level. It is evident that periods of heightened volatility coincide with dealer inventories that are dramatically gamma negative.
Source: OptionMetrics
Whipsawing Markets
During the weeks following the initial Coronavirus shock, the market experienced a series of gyrating returns, which has not been seen since the great depression. An example of this starting on March 10th was +4.9%, -4.8%, -9.5%, + 9.2%, -11.9%, +6%. These return swings were exacerbated by the flip-flopping hedging activity from dealers.
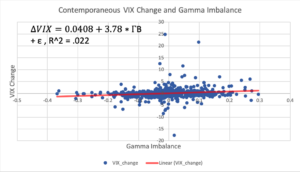
To illustrate this point, I construct a gamma imbalance measure using signed tick data from SPX options, measured as (Net Demand of Call $ Gamma – Net Demand Put $ Gamma) / Total $ Gamma. Net Demand is calculated as the aggregate gamma dollar sum of the buy orders less sell orders across all contracts. Positive values show a tilt towards long gamma, negative values towards short put gamma. This measure gives a stronger sense of daily imbalances since trades can be classified directionally, rather than simple volume.
Figure 2 is a plot of daily VIX changes and gamma imbalances beginning in March 2018 to present. I acknowledge this relationship is probably extremely non-linear, but I will leave that for another post. A simple linear regression shows a positive relationship between changes in VIX and gamma balance. On average, dealers are contrarian with vol spikes accompanied by gamma balances shifting towards long call gamma. However, the daily explanatory power is weak with an R-squared of 2.2%
Source: OptionMetrics
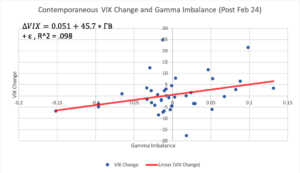
A more compelling relationship is seen when the sample is limited to post February 24th. The imbalance slope steepens dramatically. Additionally, the explanatory power increases by 5 times to nearly 10 percent! In the presence of a liquidity shock, contrarian gamma demand clearly intensifies, resulting in a larger impact of convexity flows. This new paradigm explains the violent price fluctuations observed in March. In order words, after a large up move (VIX drop), short gamma is piled on. When the market reverts the transitory imbalance the next day, the gamma balance swings the other direction. This flips the switch for another bout of short gamma flows, and on and on.
Source: OptionMetrics
Where do we go from here?
Over the last few weeks, the market has seen a substantial rally, recovering over 20% of its earlier drawdown. Over this period, the large negative gamma imbalance has reverted to breakeven levels (Figure 1) consistent with falling VIX levels and subsiding fears regarding the virus. The balanced dealer books should support smoother sailing ahead. However, the market has yet to truly digest fundamental news regarding the total economic fallout from COVID-19. Future dealer inventory may be a catalyst for the same violent price moves we witnessed in March.


