Midterm elections are next Tuesday, and the obvious question for investors is how the results may affect markets. Do midterm elections affect returns and implied volatility? Has the effect changed over time? Is the effect greater if both houses change party?
To find out, we reviewed 27 midterm election years going back more than a century to 1918 (six days before the end of WWI). Specifically, we used the S&P 500 (SPX) extending back to 1962 and the Dow before then. For volatility, we used the VIX starting from 1990. We then compared midterm year returns and implied volatility changes over various time periods to non-election years (years 1 and 3 of the presidential term). The results are below:
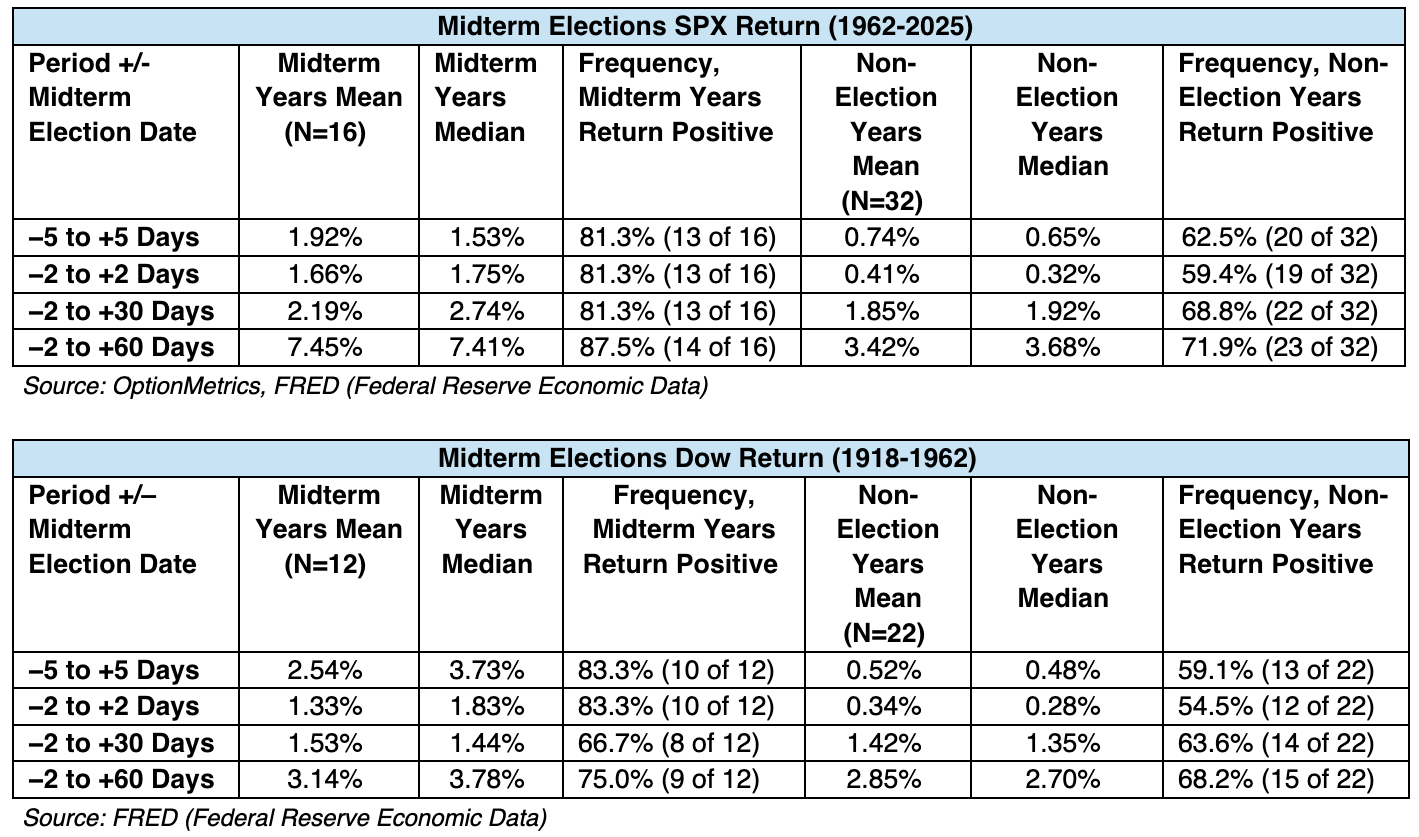
As the data above indicates, and regardless of which era or period is reviewed, returns surrounding midterm election years are clearly higher than those observed during non-election years and have much greater positive frequencies. Longer-term, the advantage remains significant but decreases as factors other than the election assert themselves.
Implied volatility as measured by the VIX shows a clear pattern during midterm election years:
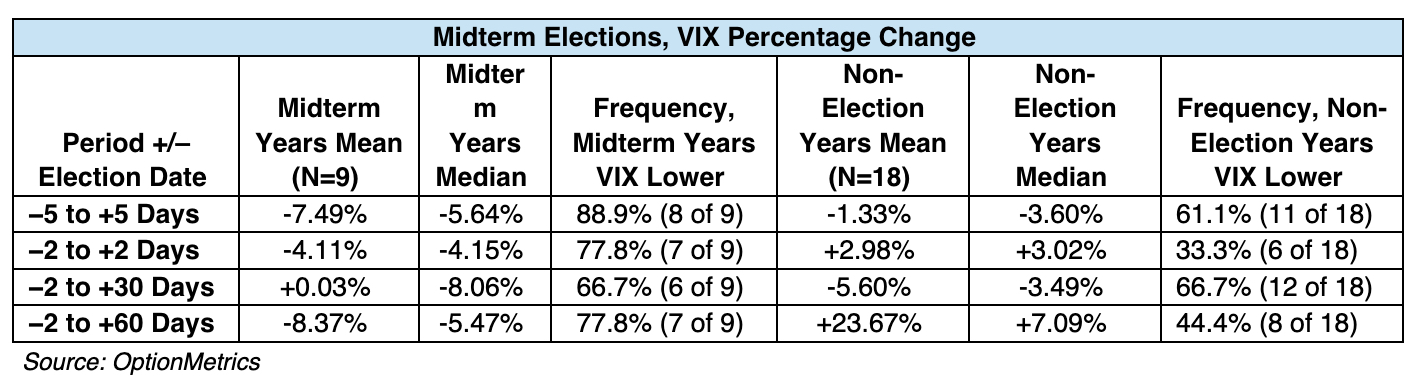 Evidently, volatility decreases in each period compared to non-election years. Similar to the tendency of implied volatility to decrease after corporate announcements (“vol crush”), uncertainty surrounding the election decreases after the event, driving implied volatility lower.
Control of Congress shifted dramatically in 1918, 1946, 1994, and 2010, with both chambers flipping in 1918, 1946, and 1994 and a 63-seat House wave in 2010. Did these extreme power shifts produce different results?
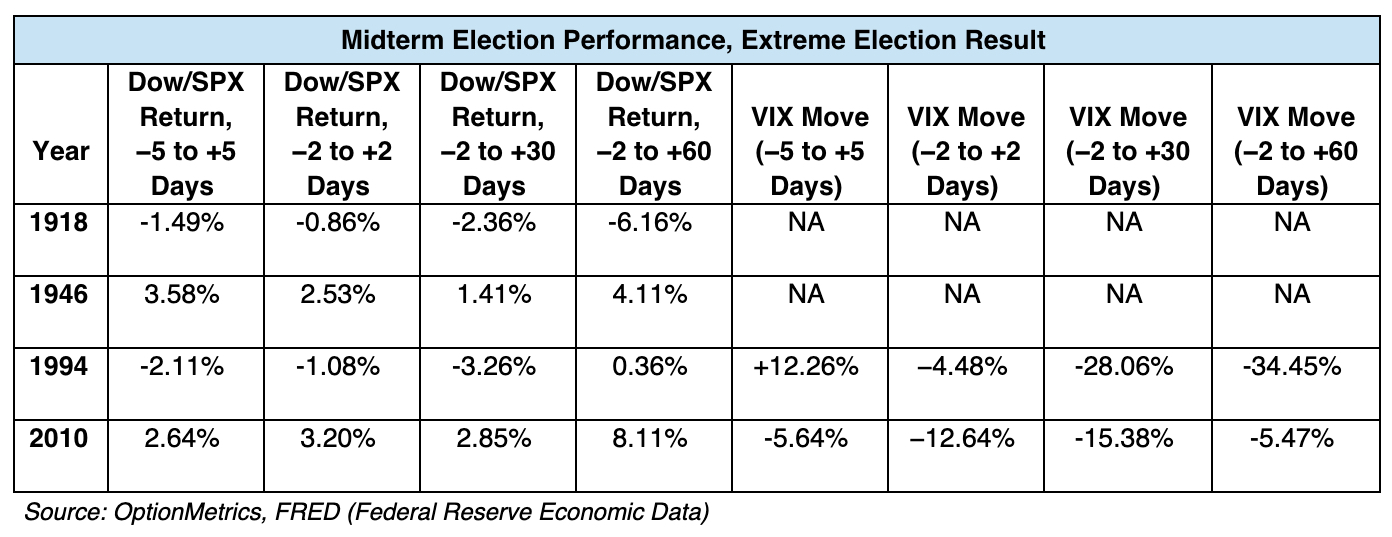 Compared to midterm elections in which only one side changed control, returns are less consistent and more prone to be negative. Predictive power is therefore limited by the varied results and small sample size.
Overall, the results are clear: the period surrounding midterm election years produces higher returns and lower volatility than non-election years. In the immediate window (−2−2 to +2+2 days), both the modern S&P 500 and the pre-1962 Dow demonstrate a striking short-term edge, advancing in 81.3% to 83.3% of midterm cycles (+1.66% SPX mean, +1.33% Dow mean). This is more than four times greater than the return observed during non-election Novembers (+0.41% SPX, +0.34% Dow). Unsurprisingly, the VIX decreases during the same period as election uncertainty and fears are resolved. Longer-term, the midterm election edge is maintained with extremely high positive frequencies (-2 to +60 days = 87.5% for 1962 – 2025).
Many will argue that markets and politics have changed significantly since 2008 and that previous historical periods, although interesting on a comparison basis, are ultimately inapplicable. However, the 108-year history reviewed above reveals consistent results: higher returns and lower volatility surround midterm elections.