Garrett DeSimone
Oscar Shih
Retail-driven trading returned to the spotlight on June 24, 2026, when a viral post on Reddit’s r/WallStreetBets urging investors to “Save Wendy’s before it’s too late” triggered a surge in buying interest. Wendy’s (NYSE: WEN) shares rose approximately 25% on the day, from $6.25 to $7.81, a pattern reminiscent of the meme stock episodes that defined 2021, when coordinated retail activity in names like GameStop and AMC generated dramatic price dislocations and forced short covering across institutional books.
Episodes like this highlight how quickly coordinated retail activity can reshape the trading landscape. Sudden bursts of retail order flow can drive sharp increases in realized and implied volatility, making it more challenging for market makers and institutional participants to manage inventory and hedge option exposure. In the original GameStop episode, dealer gamma exposure became the transmission mechanism for retail flow into underlying price moves, as market makers hedging short call positions were forced to buy stock into a rising market. The Wendy’s rally suggests this pattern hasn’t gone away—the mechanics that made 2021 unusual have become a recurring feature of markets where retail can coordinate at speed.
Detecting these shifts in real time has therefore become increasingly valuable, both for market makers managing exposure and for anyone trying to understand the composition of flow behind unusual price action.
OptionMetrics’ TradeFlow product provides a detailed classification of option trading activity, including identification of buy orders versus sell orders. Additionally, TradeFlow estimates retail activity at 5-and 30-minute intervals.
However, retail identification is not a trivial matter. Options exchanges don’t publish account type or broker identity on the public tape, so retail identification has to be inferred from trade characteristics like execution mechanism, size, and routing flags. Each inference approach captures a different subset of retail, ranging from strict microstructure signatures that identify retail flow decisively to broader broker-identity classifications used by exchanges themselves. These methods can produce retail share estimates ranging from 6% to 60% for the same market, depending on where the definition is drawn. No single methodology is universally right; each answers a slightly different question about what constitutes retail flow.
Given the complexity of retail identification, TradeFlow estimates retail trading flows into 3 categories.
- Retail 1 is defined as SLAN trades with size less than or equal to 10 contracts. This is the most conservative and precise measure of retail activity. SLAN (Single-Leg Auction Non-ISO) trades route through Cboe’s Automated Improvement Mechanism (AIM), which was designed specifically to provide price improvement for retail order flow. Academic research establishes SLAN as the gold standard identifier of retail options flow, showing it reliably captures orders routed through PFOF wholesalers to exchange auctions.
- Retail 2 is defined as AUTO trades with sizes less than or equal to 10 executed at NBBO. This measure is the broadest and most institutionally contaminated. It captures retail flow from non-PFOF brokers that route directly to exchanges and take displayed quotes but also includes institutional algorithmic flow that slices parent orders into small clips. Because retail orders are predominantly marketable — hitting the displayed quote rather than providing liquidity — small NBBO-taking flow retains a retail signal even without the auction routing.
- Retail 3 is defined as AUTO trades with sizes less than or equal to 10 executed inside the NBBO with a nominal value less than $5,000. This measure is more inclusive than Retail 1 but cleaner than Retail 2, capturing price-improved AUTO executions. Price improvement inside the NBBO is a signature of wholesaler internalization for retail orders under best-execution obligations (Ernst and Spatt, 2022), while the premium filter excludes larger institutional position adjustments in expensive contracts.
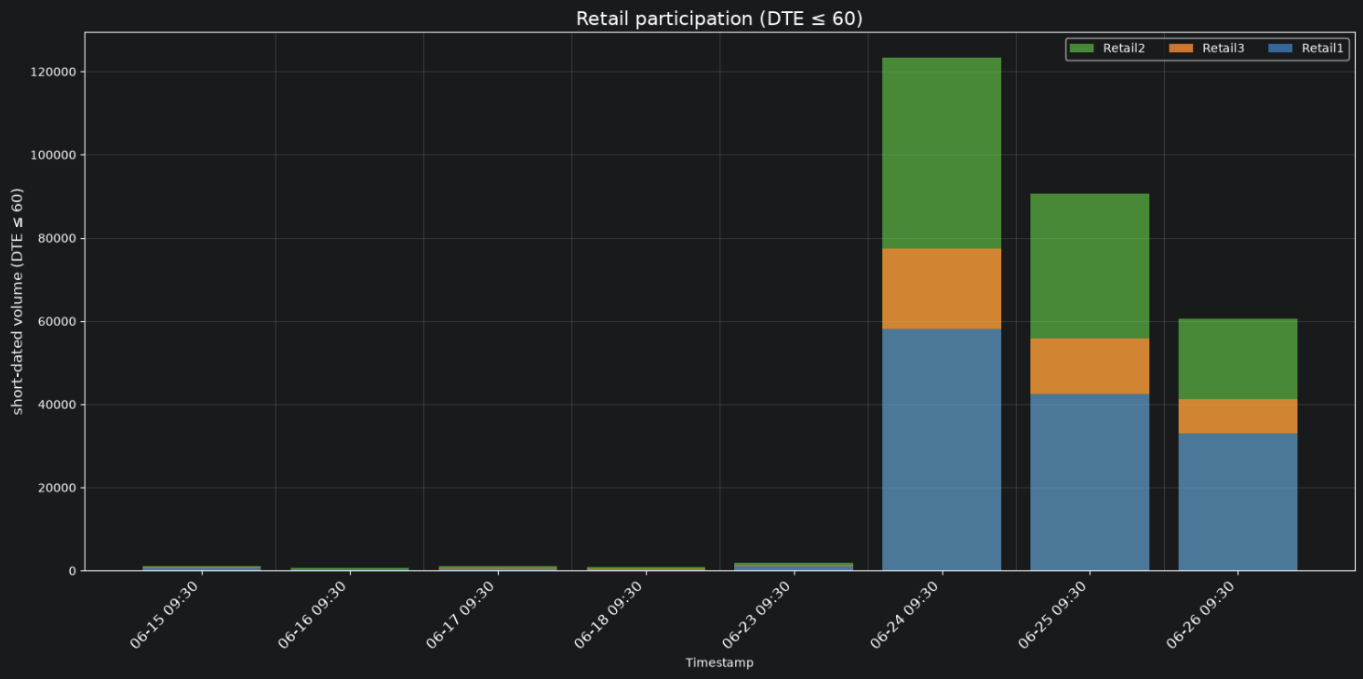
For this analysis, we focus on Wendy’s short-dated options with fewer than 60 days to expiration. Using our three retail measures, we construct a bounded estimate of total retail activity: Retail 1 alone serves as the lower bound (most conservative, decisively retail); the sum of Retail 1 and Retail 3 provides a high-conviction midpoint (extending coverage while maintaining reasonable precision); and the sum of all three measures gives the upper bound (broadest coverage at the cost of some institutional contamination). This construction produces a confidence interval around true retail activity, with the midpoint representing our best point estimate.
 Source: OptionMetrics
The change in retail trading activity was significant. Prior to June 24, estimated retail volume held steady at roughly 3,000 contracts per day. On June 24, retail participation surged to approximately 120,000 contracts—an increase of more than 85x. Elevated retail activity persisted over the following trading days, indicating that the momentum extended well beyond the initial catalyst.
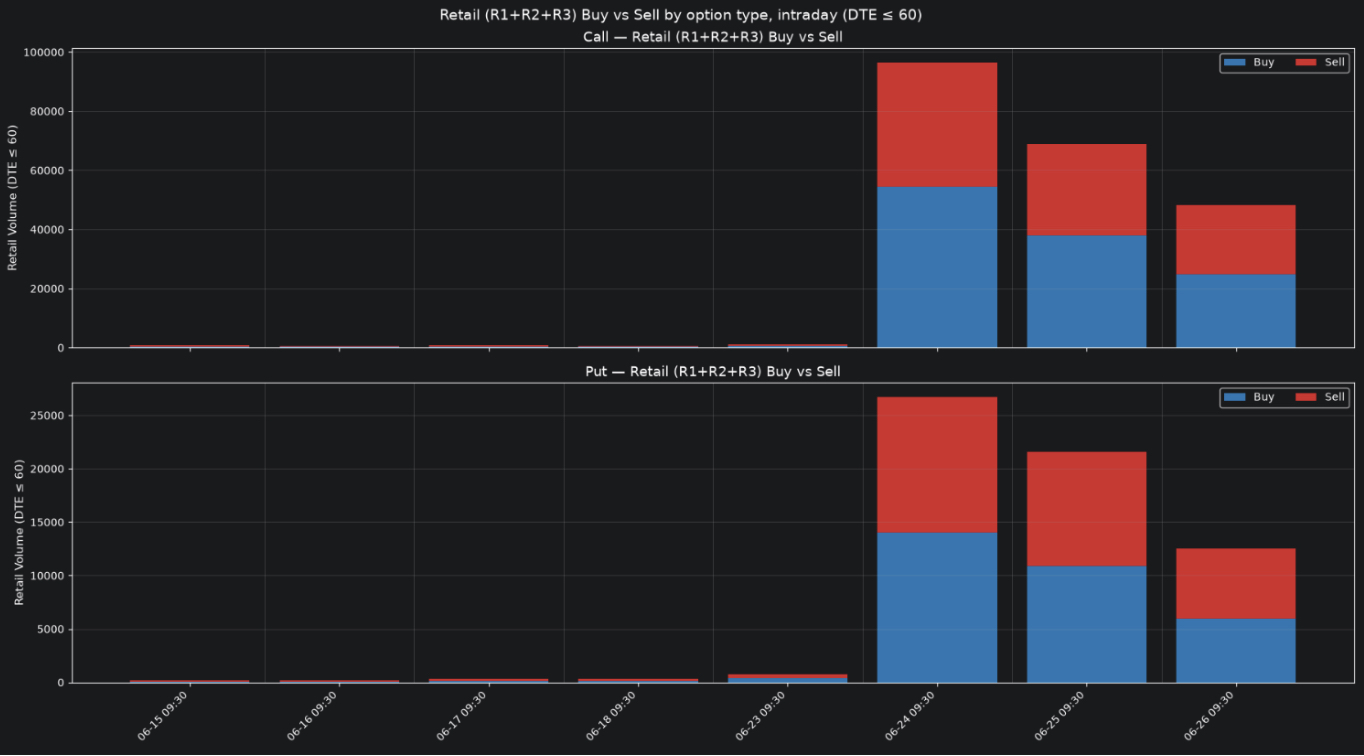
The surge was concentrated in call options, consistent with retail investors positioning for further upside following the Reddit post. On June 24, retail traded four calls for every put, showing that bullish speculation dominated the flow even as put activity also rose in absolute terms.
 Source: OptionMetrics
 Source: OptionMetrics
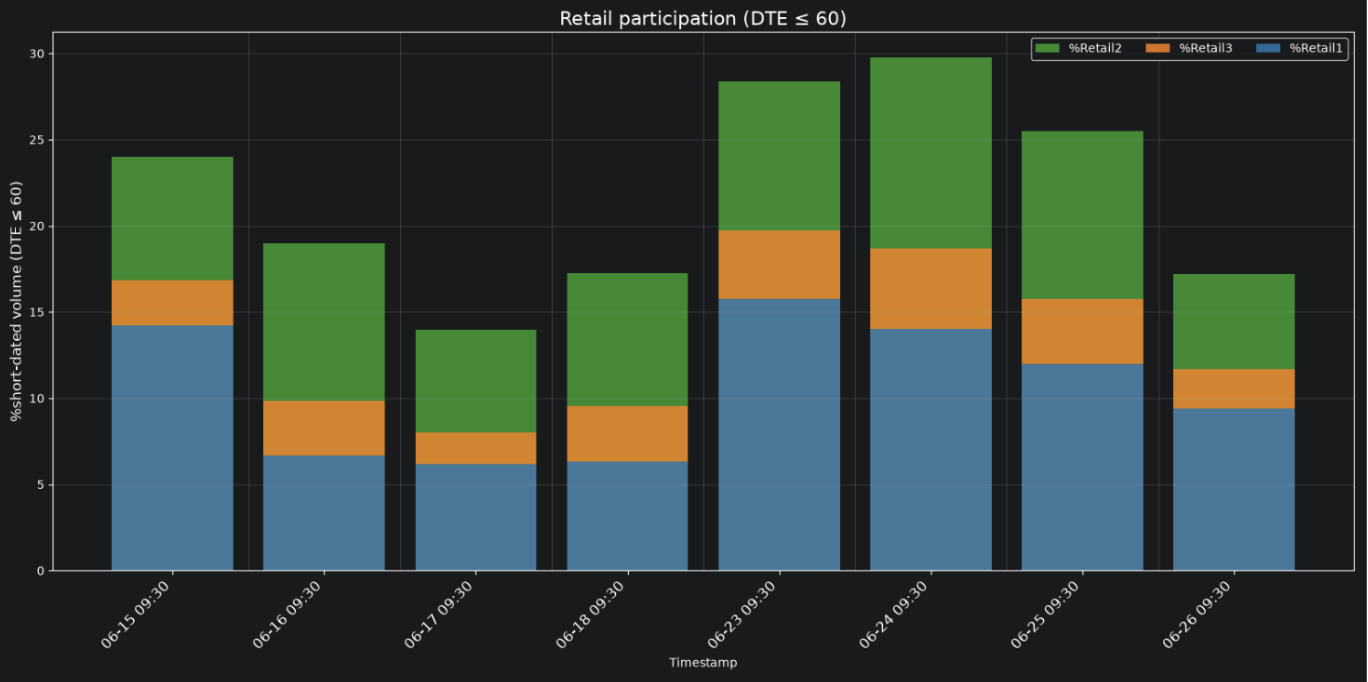
Beginning June 23, we observe a marked increase in retail’s share of total options activity, with our midpoint estimate nearly doubling from 10% to 20%. Our conservative lower-bound estimate rose in parallel, from 5% to over 15%.
The composition of the flow suggests the Reddit-driven rally was fueled primarily by bullish retail demand for short-dated calls rather than defensive or bearish positioning. Concentrated call buying of this scale creates hedging pressure on dealers, who must buy underlying shares to remain delta-neutral against short call inventory—potentially amplifying the stock’s price move through the gamma channel. Together with the sharp increase in overall retail participation, the data demonstrates how TradeFlow can identify not only when retail investors enter the market but also how they express their views through the options market.