On “Liberation Day”, markets experienced a sharp reset. Since that time, the subsequent rebound in U.S. equities has been led overwhelmingly by the top 10 names in the S&P500 (‘SPX’). As shown in the chart below, this portfolio, dominated by large-cap technology and AI-related firms, has surged nearly +46%, compared to roughly +15% for the rest of the index. SPX itself sits nearly +25%, suggesting that virtually all the post-liberation day gains have been concentrated in a handful of stocks.
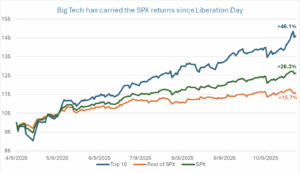
Source: OptionMetrics
This degree of concentration is not new, but the magnitude is notable. Similar dynamics were seen in the late stages of prior bull markets when index-level performance masked internal weakness among smaller constituents. Given these risks, we are interested in the potential crash risk exposure of AI and mega cap tech companies. Even well-known contrarian investors, such as Michael Burry, have reportedly built sizable put positions in anticipation of a potential bubble unwind, highlighting growing unease that the AI-led rally may be overextended. With valuations stretched and investors positioning heavily tilted toward these leaders, crash-risk concerns have become increasingly relevant. We construct a proxy for a tail-risk factor, capturing downside pricing pressure from option prices.
Using OptionMetrics IvyDB US Intraday data, we compute a tail risk factor for the top ten constituents of the S&P 500 and compare it with the corresponding index-level measure. Our approach builds on the framework of Bollerslev and Todorov (2011), which shows that compensation for rare crash events can be inferred from option-implied tail densities. Building on this framework, we define a practical proxy for tail risk as the ratio of option price to forward price, using five-day options with a 30-delta point from the Volatility Surface table, observed at 3:45 p.m.
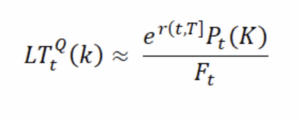 This measure serves as a practical indicator of tail risk, as deep out-of-the-money options nearing expiration primarily reflect the market’s pricing of rare, discrete downside jumps. It captures how much investors are willing to pay for crash protection relative to the forward level of each stock. The ratio is then computed for the top ten constituents—weighted and normalized by their index weights—and compared with the same measure for the overall S&P 500.
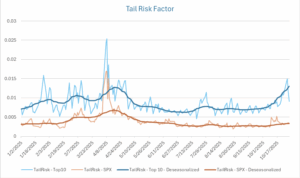
Source: OptionMetrics
The chart above shows the trend in our tail risk factor for the top 10 S&P 500 constituents compared with the broader index. For most of the year, both measures moved closely together, but a clear divergence appeared in October. The top ten equities, which have driven the majority of gains since Liberation Day, experienced a steady rise in crash risk while the rest of the index remained relatively flat. This points to a higher price for short-dated crash protection and greater implied probability or large negative moves in the very stocks that have carried the market. To isolate genuine trend shifts, we remove recurring earnings-related seasonality using STL (season-trend using LOESS) decomposition, which filters out predicted spikes in tail risk around earnings.
An increase in the tail risk factor reflects greater pricing of extreme downside events through options. Historically, a rising tail risk factor signals that markets are beginning to price asymmetry: when returns are concentrated in a few names, any change in sentiment can magnify losses. This pattern is consistent with the findings of Bollerslev and Todorov (2011), who show that compensation for rare events, known as tail risk premia, tends to rise sharply during periods of market stress and heavy concentration.
The recent shift appears to reflect rising anxiety rather than simple hedging. After a strong run driven by enthusiasm for AI and large technology firms, valuations have reached levels that many view as stretched, with positioning increasingly crowded in a handful of dominant names. This combination could be indicative of early signs of bubble dynamics, where optimism and momentum begin to outpace fundamentals. Whether this marks a prudent hedge or the start of a broader sentiment change is uncertain at this time, but the October rise in tail risk suggests that investors are increasingly pricing vulnerability into the very stocks that have powered the market higher.
REFERENCES
Bollerslev, Tim, and Viktor Todorov. 2011. “Tails, Fears, and Risk Premia.” The Journal of Finance 66 (6): 2165–2211.