Reminiscent of the dot.com mania of the late 90’s, investors are naturally asking whether stocks associated with artificial intelligence, specifically Nvidia, are in the midst of a financial bubble. Since the exact definition of a bubble is as varied as there are economists, the answer, in my experience, is usually subjective and based more on intuition than quantitative metrics. Adding to the difficulty is that bubbles are much easier to identify in retrospect than in real time. Everyone is familiar with the more famous bubbles of recent times — dot.com stocks, Japanese real estate, Bitcoin, and GameStop — as well as some of the most famous in history, such as the South Sea Company and Tulipmania, but few can consistently identify bubbles during their formation or, more importantly, predict when they are going to implode.
Can options data be used to supplement more traditional metrics to help identify possible bubbles? Or at least suggest unsustainable or questionable trends? We reviewed three options-based volatility metrics to find out: the trend of implied volatility, out-of-the-money to at-the-money skews, and risk premiums.
1) First, the near term trend of implied volatility. Since implied volatility is a measure of uncertainty, it follows that as the underlying trend becomes more pronounced and price action more frantic and abnormal (as it would in a bubble), then implied volatility should increase. However, if the trend is orderly, and without major corrections, then implied volatility will tend to decrease. This becomes clearer if you view implied volatility from the perspective of a market maker that must hedge each option they transact. If hedging is relatively easy due to predictable price movement in the underlying, then their hedging “costs” decrease and they can afford to lower implied volatility. If the underlying trend becomes unpredictable or extremely pronounced, or if critical earnings announcements are impending, then they the market maker will raise implied volatility to compensate.
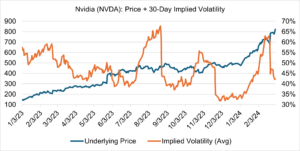
Using Nvidia year-to-date price action as an example (below), you can see this effect in both directions. NVDA’s rally since the beginning of the year was pronounced and aggressive; market makers responded accordingly by raising implied volatility, which peaked right before the critical Q4 earnings announcement in late February. After extremely favorable results were revealed, it became apparent that the rally was fundamentally justified, uncertainty decreased, and implied volatility fell significantly.
Source: OptionMetrics
2) Second, out-of-the-money to at-the-money skew, in this case the difference between out-of-the-money and at-the-money implied volatility. Since bubbles attract attention from inexperienced investors looking for fast, outsized returns, these investors naturally gravitate towards relatively low premium (“cheap”) out-of-the-money options, strikes in which outsized returns and higher leverage are possible. It follows that the skew should therefore increase as investors rush to buy these relatively low delta strikes.
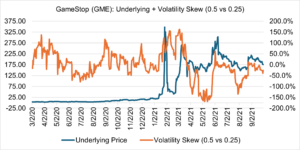
GameStop (GME), a famous (infamous?) and relatively recent bubble, provides a good illustration of skew expansion and contraction. Its two bubble inflation phases in Q1 2021 witnessed a significant skew expansion. When the bubble finally burst, skew plummeted as buyers of out-of-the-money options fled the market.
Source: OptionMetrics
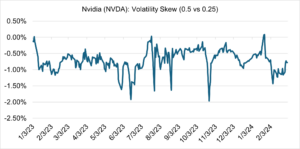
Currently, NVDA is not displaying abnormal skew, indicating that out-of-the-money options, despite their relatively high volume, are not relatively overvalued versus at-the-money strikes. Apparently, retail investors are not frenzied buyers.
Source: OptionMetrics
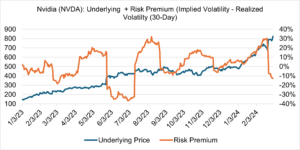
3) And last, the risk premium, defined here as implied volatility minus 30-day historical volatility. Since implied volatility is the market’s expectations for future price variance and historical volatility is the market’s expectations for historical price variance, then the difference must be the risk premium, or the degree of uncertainty built into each option’s premium. Put another way, the risk premium is the markets’ estimation of the degree to which past price movement may fail to predict current price variation.
In a bubble, as the underlying experiences significant daily price increases, and anxiety regarding the viability of the trend increase, the risk premium will be extreme compared to historical norms. This is not surprising, as historical volatility (a daily average over a period of time) will not have enough time to upwardly adjust to higher price levels while implied volatility is free to race upward. However, there can be another interpretation: sudden and extreme movements in the risk premium can also indicate that a critical earnings announcement is imminent or has occurred and has no bearing on whether a bubble is forming or not.
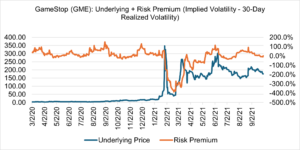
GameStop and Nvidia illustrate both interpretations. As is apparent from the chart below, GameStop’s risk premium clearly reflected that its bubble was inflating, and then deflating, over a relatively short period:
Source: OptionMetrics
On the other hand, Nvidia’s risk premium has fluctuated due to critical earnings announcements. Reflecting investor anxiety before each release, implied volatility increases; after favorable financial results that support the upward trend become known, it subsequently decreases. The resultant fluctuation in Nvidia risk premiums can therefore be considered normal, within historical norms, and not displaying bubble-like behavior:
Source: OptionMetrics
Distinguishing between a security that is in a steep bull market, with high volume and great fundamentals, versus one that has accelerated into a full-fledged bubble is a difficult exercise.
Including options-based volatility metrics can provide some helpful clarity into this process. As an example, we reviewed three alternative factors — the trend of implied volatility, skew, and the risk premium — to determine whether Nvidia, given its spectacular 80% + ytd performance, is in some stage of bubble formation. All three appear to indicate that the stock is most likely not in a bubble but rather is in an extended, consistent, and aggressive bull market, for now (and despite the price action of the last few days). Of course, NVDA may eventually develop into a bubble, but currently, based on the above analysis, it is probably not.
Yash Sinha, a FRE candidate at the NYU Tandon School of Financial Engineering, assisted in the production of this article.
