One investing theme in 2022 was the failure of tail-risk hedges amid a grinding bear market. The performance of protective put strategies, an oft touted hedge to down markets, was suboptimal. As a baseline example, the CBOE 5% Put Protection Index registered a yearly loss of nearly -16%.
This is a result of OTM put option premiums stubbornly falling throughout the year. The implied volatility (IV) skew gives a relative sense of expensiveness of OTM put prices compared to OTM call prices. When skew is falling, it signals a decrease in put volatility compared to calls. A chart showing the IV skew for S&P 500 Index options is displayed below.
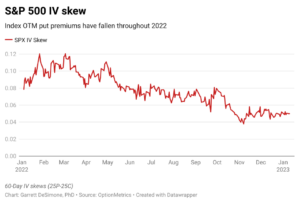
End-users of index puts are comprised mainly of institutional hedgers, such as those at pension funds and other customers of brokers. The demand by these end-users is a central driver of the prices of put protection. During 2022, demand for index puts simply did not exist.
However, the skew patterns of mega tech stocks have behaved far differently. During normal periods, skews for single stocks are typically much lower than that of the index. The primary reason for this is:
- Institutional investors tend to dominate demand for index puts. Retail investors, conversely, tend to primarily trade in single name OTM calls, due to a preference by many for lottery like payoffs.
- OTM index puts command a higher price, due to the correlation risk of basket stocks. OTM puts serve as a hedge against increased correlation between stocks during market turmoil.
Throughout last year, skew values on FAANG names have trended upward, as a result, in shifting demand toward single stock hedges. Graph 2 demonstrates the average skew values on these stocks versus the SPX. As shown in the chart, FAANG skews began exceeding SPX skews in mid-2022. This phenomenon is extremely rare.
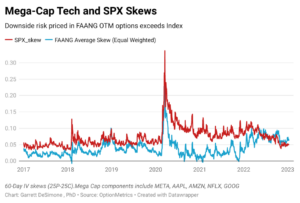
One likely reason for this pattern is that investors are more fearful of FAANG single stock crashes, due to mounting firm-specific risks to this sector. This likely attributed to analyst pessimism around earnings and potential regulation risks. In other words, options investors have a larger aversion to downside moves in FAANG due to company-specific news, as opposed to broader macro factors, which would be reflected in index options.